Chapter 7: Week 3, Session C — Copilot in Excel
Data Analysis, Visualization, and the Death of the Manual Pivot Table
1Chapter 7: Week 3, Session C — Copilot in Excel
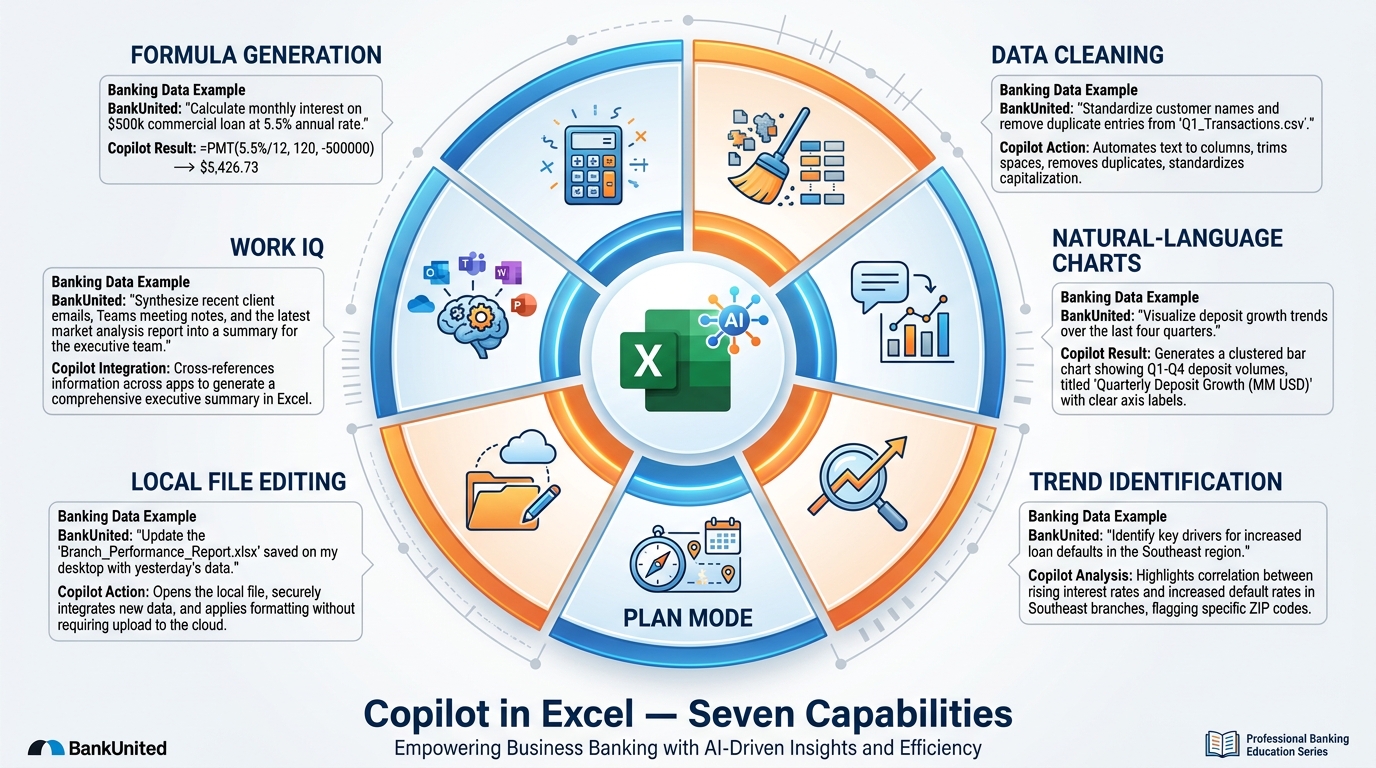
Figure 1:Copilot in Excel’s confirmed capability pillars — each one eliminating a category of mechanical analytical work that has consumed banking professionals’ time for decades. The shift is not from human to machine. It is from mechanical execution to professional judgment.
“The goal is to turn data into information, and information into insight.” — Carly Fiorina
Here is a question worth sitting with for a moment.
How much of your last week was spent thinking about data — drawing real conclusions from it, making decisions based on it, seeing patterns that changed how you understand the business — versus wrestling with data? Fighting with formulas. Manually formatting columns. Building Pivot Tables that took 45 minutes and had to be rebuilt when the source data changed. Searching for which row had the inconsistent date format that broke the entire import.
For most banking professionals, the honest answer is uncomfortable. A disproportionate share of what we call “analysis” is actually data wrangling — the mechanical, unglamorous labor that precedes the thinking. The thinking is what we were hired for. The wrangling is what we do instead.
That ratio is about to change.
Copilot in Excel does not make you a better data wrangler. It makes data wrangling significantly faster and less painful. What used to take hours — building the right formula, cleaning an inconsistent export, creating a chart, surfacing the outliers in a dataset — now takes minutes, and often seconds. The ceiling of what you can ask of your data, without being a data scientist, rises dramatically.
This chapter covers every confirmed Copilot-in-Excel capability, grounded in what Microsoft’s official documentation actually supports today. We will also be direct about the limits — what Copilot cannot reliably do and why that matters in a banking context where the cost of analytical error is real. By the end, you will know how to use these tools effectively and how to use them safely.
Every concept lands on a BankUnited example — DDA growth, branch performance, loan portfolio analysis, deposit composition — because that is the data you work with.
1.11. The Foundation — Setting Your Data Up Correctly
Before a single Copilot feature will work in Excel, one thing must be true: your data must be formatted as a table.
This is not a minor technical footnote. It is the architectural requirement that makes everything else in this chapter possible. If you send this chapter to your desk drawer after reading it, take one thing with you: format your data as Excel tables.
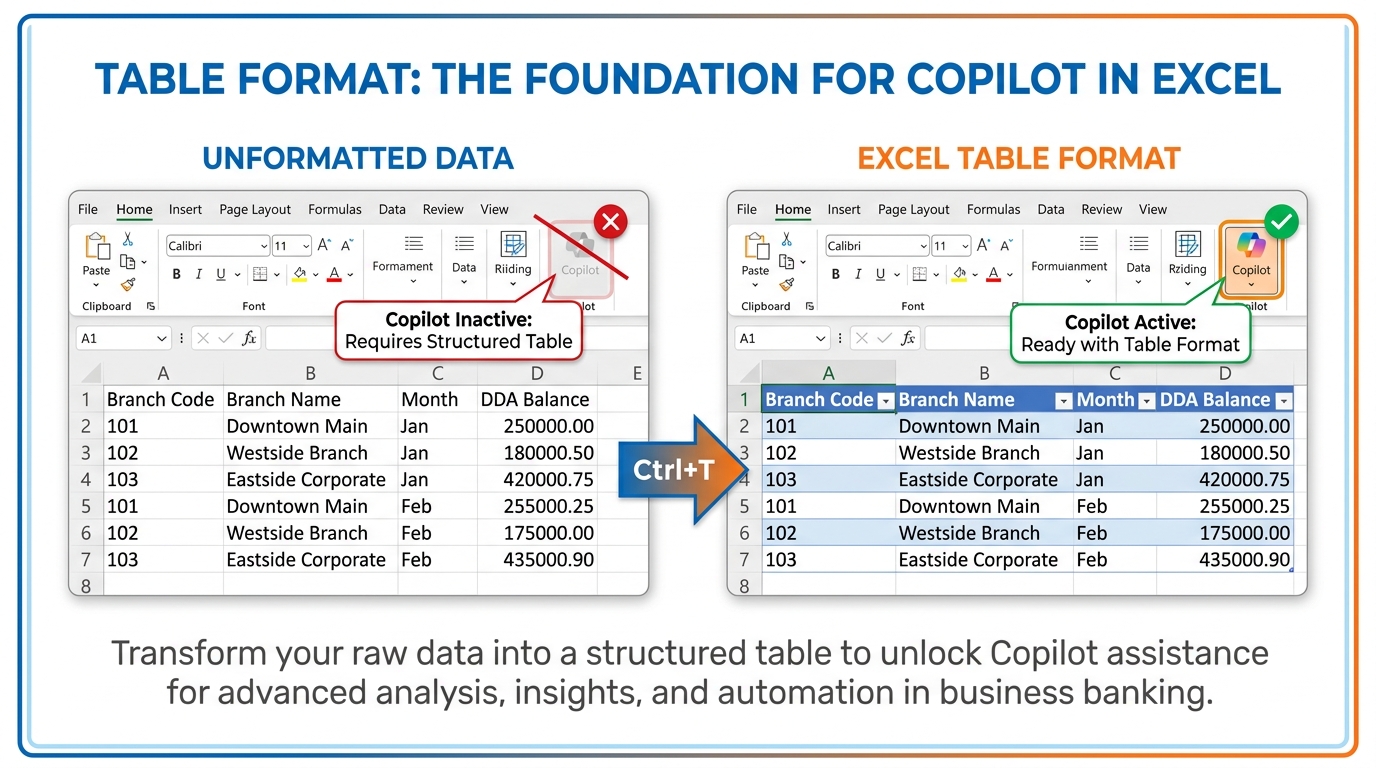
Figure 2:The table format requirement is the foundation that unlocks every Copilot capability in Excel. Without it, Copilot cannot read your data. With it, every feature in this chapter becomes available.
Why tables are required:
Copilot in Excel works by reading the structure of your data — understanding which columns contain what kind of information, where the headers are, where the data begins and ends. An Excel table provides exactly that structure in a form Copilot can interpret. A plain range of cells — even one that looks like a table — does not give Copilot the structural information it needs.
How to format data as a table:
Click anywhere inside your data range.
Press Ctrl + T (Windows) or ⌘ + T (Mac). Or go to Insert → Table.
Confirm that the “My table has headers” checkbox is checked.
Click OK.
Your data is now an Excel table. The Copilot button in the Home tab ribbon will activate immediately.
Where Copilot can read your files:
Copilot in Excel works with files stored in OneDrive or SharePoint — the cloud-connected Microsoft 365 file locations. If you are working from a file saved locally on your device, Copilot functionality requires that file to be synced to OneDrive. The simplest approach: always save your working Excel files to your OneDrive for Business, and Copilot will have full access.
Column headers matter more than you think:
Copilot uses your column headers to understand what the data means. A column labeled “Bal” is harder for Copilot to interpret correctly than one labeled “Average DDA Balance.” A column labeled “Dt” is ambiguous; “Transaction Date” is not. Invest two minutes in naming your columns clearly — it pays dividends in every Copilot interaction that follows.
1.22. Formula Generation and Explanation — The End of the Syntax Search Loop
Let’s start with the capability that will save you the most accumulated time in the shortest period.
Every Excel user has experienced this: you know what calculation you need. You know roughly which function would do it. But the exact syntax — the argument order, the data type requirements, the nested logic — is just out of reach. So you open a browser tab, search “Excel XLOOKUP syntax,” read through three different explanations, come back, try it, get a #REF! error, go back to the browser, try again.
That loop is over.
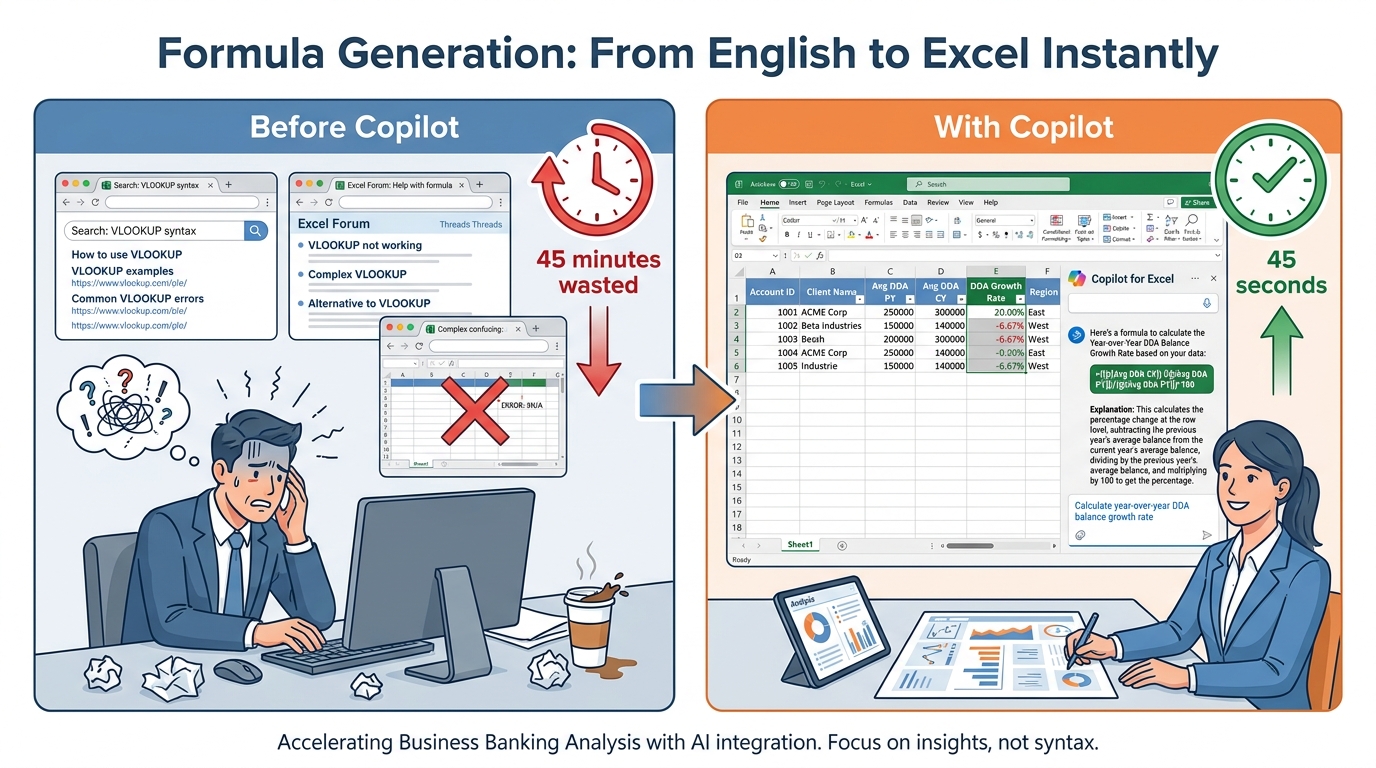
Figure 3:The formula syntax search loop was never valuable work. It was a tax on knowing what you want but not knowing the exact language to express it. Copilot eliminates that tax — and then explains what it built, so you understand what is in your workbook.
How formula generation works:
Open your Excel workbook (in OneDrive, formatted as a table). Click the Copilot button in the Home tab ribbon. The Copilot pane opens on the right side of your screen. Describe the calculation you want in plain English:
“In a new column, calculate each branch’s year-over-year DDA balance growth rate. The current year average balance is in the ‘Avg DDA Balance CY’ column and the prior year is in ‘Avg DDA Balance PY’.”
Copilot reads your table structure, understands the columns you referenced, and generates the formula:
=(([@[Avg DDA Balance CY]]-[@[Avg DDA Balance PY]])/[@[Avg DDA Balance PY]])*100Along with the formula, Copilot provides an explanation — in plain English — of what the formula does:
“This formula calculates the percentage change from the prior year average balance to the current year average balance. A positive result means the balance grew; a negative result means it declined. The result is expressed as a percentage.”
Copilot then offers to add this formula as a new column in your table. You click “Insert Column” and it is done.
The dual value of formula explanation:
Formula generation has an equally valuable counterpart: formula explanation. Click on any existing formula in your workbook — including one you inherited, one built by a former colleague, or one in a model you downloaded — and ask Copilot: “Explain what this formula does.”
Copilot reads the formula and explains it in plain English. No more decoding nested IF statements at 7am before a board presentation. No more inheriting a model and spending half a day figuring out what it is actually calculating. The explanation feature alone is worth hours of time to every banking professional who has inherited complex spreadsheet models — which is everyone.
The banking formulas where this matters most:
The modern replacement for VLOOKUP — more powerful, fewer limitations, but with a syntax that trips up even experienced Excel users. Example prompt: “Look up each customer’s relationship tier from the Tier Reference table on Sheet2, matching on Account Number.” Copilot handles the exact/approximate match setting, the if-not-found argument, and the column direction automatically.
Multi-condition aggregation — the bread and butter of branch performance reporting. Example: “Sum the loan originations in the ‘Origination Amount’ column where the ‘Branch Code’ column matches ‘FTL-001’ AND the ‘Product Type’ column contains ‘Commercial Real Estate’.”
The formulas that are readable at 9am and incomprehensible when debugging at 4pm. Example: “Create a ‘Risk Flag’ column that shows ‘High Risk’ if DPD is over 90, ‘Watch’ if DPD is 31–90, ‘Monitor’ if DPD is 1–30, and ‘Performing’ if DPD is 0.”
Aging, business days, quarter-end logic. Example: “Calculate the number of calendar days between the ‘Origination Date’ column and today. Then add a ‘Review Flag’ column that marks anything over 30 days as ‘Review Required’.”
Standard deviation, percentile ranking, trailing averages. Example: “Add a column showing the 3-month rolling average of the ‘Monthly Deposit Inflow’ column for each branch.”
The 9th Grader Test:
Think of it this way. You speak fluent English. Excel speaks fluent Formula. For 30 years, you had to learn Formula — with its exact argument order, its parenthesis matching, its cryptic error codes — to tell Excel what you wanted. Copilot is the interpreter standing between you and the Formula language. You speak English. Copilot hears you, translates to Formula, hands it back with a receipt (the explanation) so you can verify it got the translation right, and then applies it.
The interpreter does not replace your judgment about what to calculate. It removes the barrier between your judgment and Excel’s execution.
The analogy is imperfect in one important way: unlike a human interpreter, Copilot can occasionally make a mistranslation — generating a formula that looks right but has a subtle logical error. The control for this is the same as it has always been: read the explanation, spot-check the output on several known rows before accepting it for the full dataset, and never let an AI-generated formula enter a regulatory report without verification.
The revolution in your day:
Banking professionals at the analyst level spend an estimated 3–5 hours per week in the formula search loop. At the RM and manager level, it is less frequent but more costly per instance — because the formulas are more complex, and the stakes of error are higher. Eliminating that friction does not just save time. It changes which analyses you are willing to attempt. If building the right formula costs 90 minutes, you run only the analyses worth 90 minutes of setup. If it costs 90 seconds, you run every analysis worth asking.
1.33. Natural-Language Data Exploration — Asking Questions, Getting Answers
This is the capability that most changes the nature of your relationship with data.
Excel has always been a tool that answered questions you already knew how to ask in Formula. Copilot makes it a tool that answers questions you know how to ask in English. The difference is enormous for professionals who have deep business knowledge but limited programming fluency.
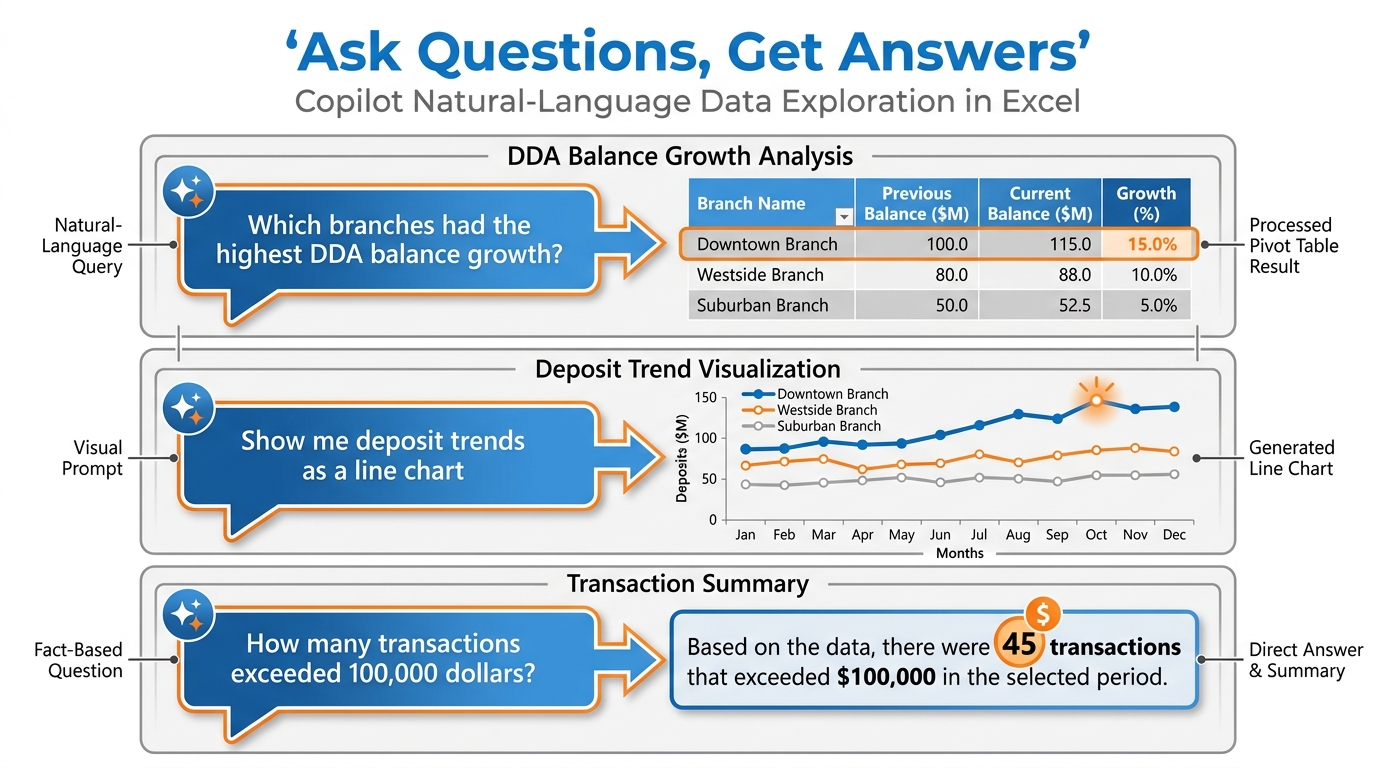
Figure 4:Natural-language data exploration collapses the distance between “I want to understand this” and “I understand this.” Ask a question. Receive a chart, a Pivot Table, or a summary — whichever format best answers it.
How it works:
With your data formatted as an Excel table and your file in OneDrive, open the Copilot pane and type your question — not a formula request, but an actual business question:
“Which branches had the highest DDA balance growth over the last four quarters?”
Copilot analyzes your table, runs the relevant calculations, and responds with one of several output types — whichever is most appropriate to the question:
A chart — a visual rendering of the answer (bar chart, line chart, pie chart, etc.)
A Pivot Table — an interactive summary table you can continue to filter and explore
A text summary — a written synthesis of the finding with key numbers highlighted
A highlighted range — specific cells in your table called out for attention
You can also ask Copilot to generate a specific output type: “Show me this as a bar chart” or “Give me a Pivot Table grouped by branch and by quarter.”
The chart generation workflow:
Natural-language chart requests are one of the most practically useful Copilot-in-Excel features for banking professionals. The old process — select range, insert chart, configure type, fix axes, fix labels, resize, format — took 15–30 minutes for a non-trivial chart. The new process is a sentence:
“Create a bar chart showing monthly deposit inflows by branch for the last six months.”
Copilot determines the appropriate chart type, maps your data columns to the correct axes, applies labels, and inserts the chart into your workbook. The chart is a standard Excel chart — fully editable, formatted however you need, exportable to PowerPoint with one click.
BankUnited data exploration prompts that unlock the most value:
“Show me which branches have seen their average DDA balance decline for two or more consecutive months.”
“Create a Pivot Table showing deposit composition — DDAs, savings, money market, and CDs — broken out by branch.”
“Give me a line chart comparing total deposit growth for the top five branches over the past 12 months, with each branch as a separate line.”
“Which product type has the highest average balance per account? Show me a bar chart.”
“Show me total loan originations by product type as a pie chart.”
“Which loan officers have the highest origination volume this quarter? Give me a ranked table.”
“Create a Pivot Table showing 30-plus day delinquencies grouped by product type and by branch.”
“Show me a trend line of net charge-off rates for the commercial portfolio over the last eight quarters.”
“Which branches are above the portfolio average on deposit growth but below average on loan origination volume? List them.”
“Create a bar chart of deposits per full-time employee by branch, sorted from highest to lowest.”
“Show me a scatter plot of loan origination volume on one axis versus DDA balance on the other, one point per branch.”
“How many transactions in this export are above $50,000? What percentage of total transaction count does that represent?”
“Show me the distribution of transaction amounts as a histogram.”
“What is the average transaction processing time by transaction type? Give me a summary table.”
The key insight:
Natural-language data exploration is not about replacing analytical thinking. It is about removing the mechanical execution barrier between a business question and a data-driven answer. The business question — the right question — still requires a professional who understands BankUnited’s strategy, its market, its client relationships, and its risk posture. Copilot handles the “now let me go build the Pivot Table to answer that” step. You own the “which question is worth asking” step — which is the more valuable one.
1.44. Highlighting, Sorting, and Filtering — Copilot as Your Data Navigator
Before we go deeper into analytical capabilities, it is worth spending a moment on a category of Copilot-in-Excel features that are less dramatic but perhaps the most immediately practical: directing Copilot to highlight, sort, and filter your data on your behalf.
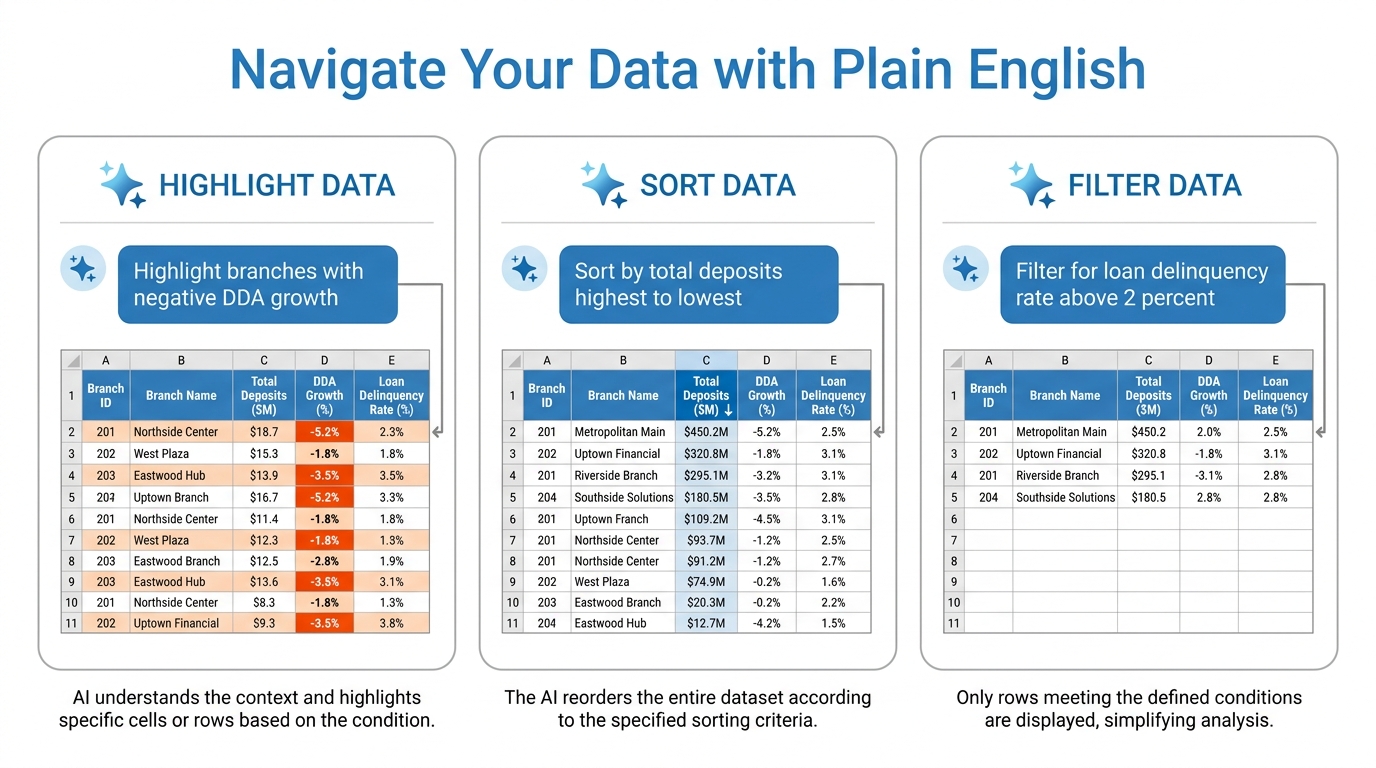
Figure 5:Highlighting, sorting, and filtering with natural language — the navigational capabilities that make Copilot feel like a data assistant sitting beside you, rather than a tool you have to configure.
What this looks like in practice:
“Highlight the cells in the DDA Growth column where the value is negative.” Copilot applies conditional formatting to those cells — red fill, or whatever you specify — so the declining branches are immediately visible without you building a conditional formatting rule manually.
“Sort this table by total deposit balance from highest to lowest.” Copilot applies the sort. One sentence, done.
“Filter the table to show only branches where the loan delinquency rate is above 2 percent.” Copilot applies the filter. You see only the branches of interest.
“Show me only the rows where the transaction type is ‘Wire Transfer’ and the amount is above $100,000.” Multi-condition filter. Applied instantly.
Why this matters in banking contexts:
The value of these capabilities is in their speed and their repeatability. A monthly branch performance review might involve the same sequence of sorts, filters, and highlights every single time — and each one, done manually, takes a minute or two of clicking and configuring. The Copilot workflow compresses that sequence dramatically and, importantly, keeps your hands off the mouse and your eyes on the data.
There is also a less obvious benefit: these operations are fully reversible and leave no permanent changes to your underlying data. Copilot’s sorts and filters work through Excel’s native sort and filter mechanisms — which means clearing them and returning to the full dataset is a single click.
1.55. Trend Identification and Outlier Detection — The Analytical Questions That Previously Required an Analyst
Here is where Copilot in Excel makes its most significant leap from tool to analyst.
The features above — formula generation, chart creation, sorting and filtering — are force multipliers on tasks that banking professionals already knew how to do. This section is different. This is about the questions you never asked your data before, because asking them required either a dedicated analyst or far more manual work than most professionals could justify in the course of a normal day.
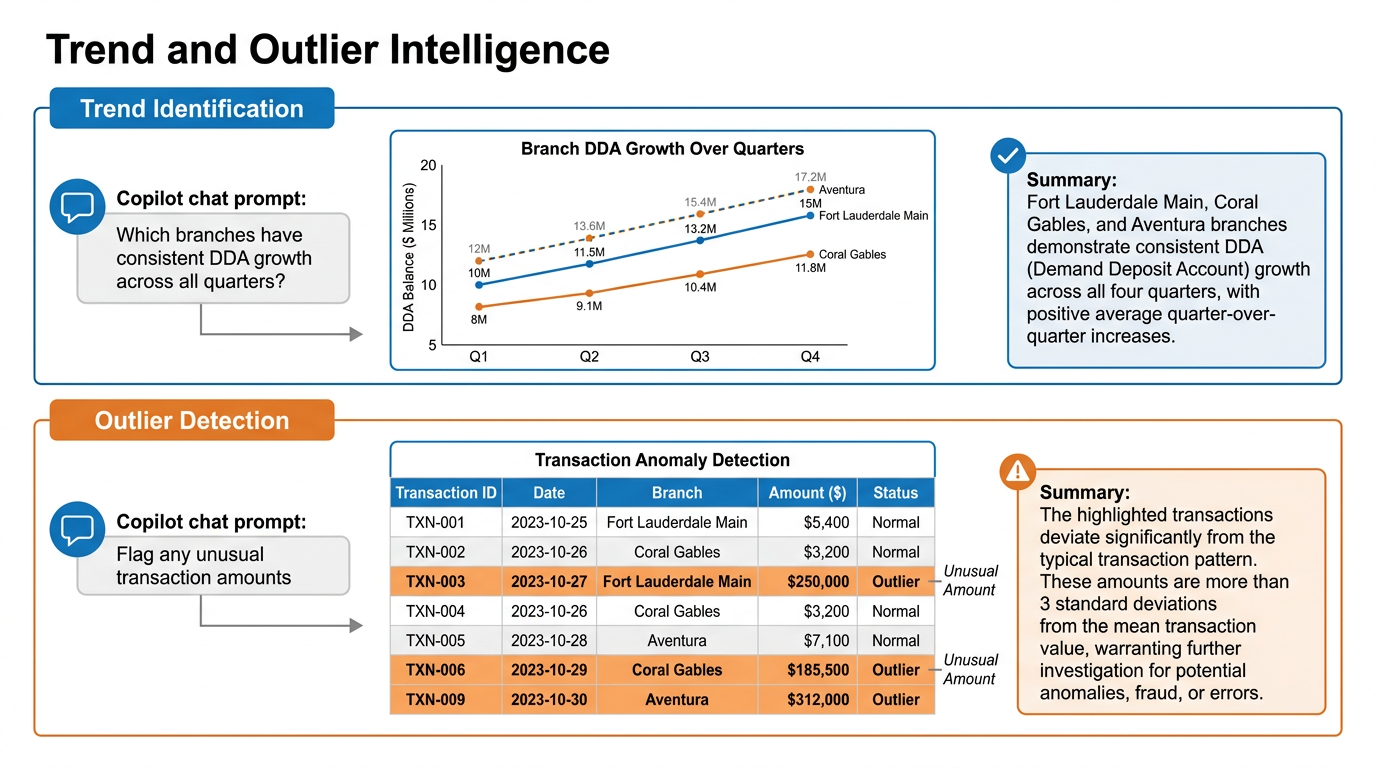
Figure 6:Trend identification and outlier detection at the question level — not the chart level. Copilot surfaces patterns you did not know to look for, in datasets too large for manual inspection.
Trend identification:
Ask Copilot to identify trends in your dataset — not just “show me this as a chart” but the analytical synthesis that goes one step further:
“Are there any consistent trends in DDA balance growth across branches over the last six quarters?”
Copilot analyzes the temporal dimension of your data, identifies directional patterns, and returns a text synthesis alongside a supporting chart. It might find: “Three branches — Fort Lauderdale Main, Coral Gables, and Aventura — have shown positive DDA balance growth in each of the last six quarters. Two branches — Hialeah and Doral — have shown declining trends for three consecutive quarters.”
That synthesis — which would have required an analyst to manually examine 18 data points across six branches and construct a narrative — arrives in seconds.
Outlier detection:
Ask Copilot to find what does not fit:
“Are there any transactions in this export that look unusual compared to the typical patterns in the data?”
Copilot applies statistical analysis to the dataset — looking for values that deviate significantly from the distribution, timing patterns that are anomalous, or combinations of attributes that appear rarely — and surfaces the findings for your review.
In a loan portfolio context: “Which accounts have DPD values that are significantly higher than others in the same product category?” Copilot identifies the statistical outliers within each product category, rather than just showing you the overall highest DPD values.
In a deposit context: “Are there any branches where the month-over-month change in average balance is unusually large in either direction?” Copilot finds the statistical extremes and flags them.
The critical professional discipline:
Here is what Copilot’s outlier detection is not: it is not a fraud detection system. It is not a compliance audit tool. It is a pattern-recognition starting point — a first pass that surfaces candidates for human investigation, not conclusions.
A transaction that Copilot flags as a statistical outlier may be:
A legitimate large wire transfer from an important commercial client
A balance adjustment that was properly documented
A correction entry that looks unusual but is fully reconciled
An actual error or anomaly that warrants investigation
The professional’s job is to investigate the flag, not to act on it. Copilot found the needle candidates in the haystack. You decide which ones are actually needles.
The BankUnited analytical questions worth asking regularly:
Table 1:High-Value Analytical Questions for BankUnited Professionals
Function | Sample Copilot Question | Output Type |
|---|---|---|
Deposit Monitoring | “Which branches have shown declining non-interest-bearing deposit ratios for three or more consecutive months?” | Trend summary + line chart |
Loan Oversight | “Are there any loan accounts where the DPD has jumped by more than 30 days since last month?” | Flagged table + text summary |
Branch Benchmarking | “Which branches are below the average on deposits per FTE? Rank them.” | Sorted summary table |
Outlier Investigation | “Show me the top 10 transactions by dollar amount this month. Do any appear unusual in the context of the full dataset?” | Highlighted rows + analysis note |
Composition Shift | “Has the ratio of commercial to retail deposits changed significantly in any branch over the last four quarters?” | Pivot Table + trend chart |
1.66. Importing Data — Copilot as Your Data Onboarding Assistant
One of the less-discussed but genuinely useful Copilot-in-Excel capabilities is assistance with data import. Copilot can help you bring data into Excel from external sources — including web pages, files in your OneDrive or SharePoint, and information from your organization’s Microsoft 365 communications.
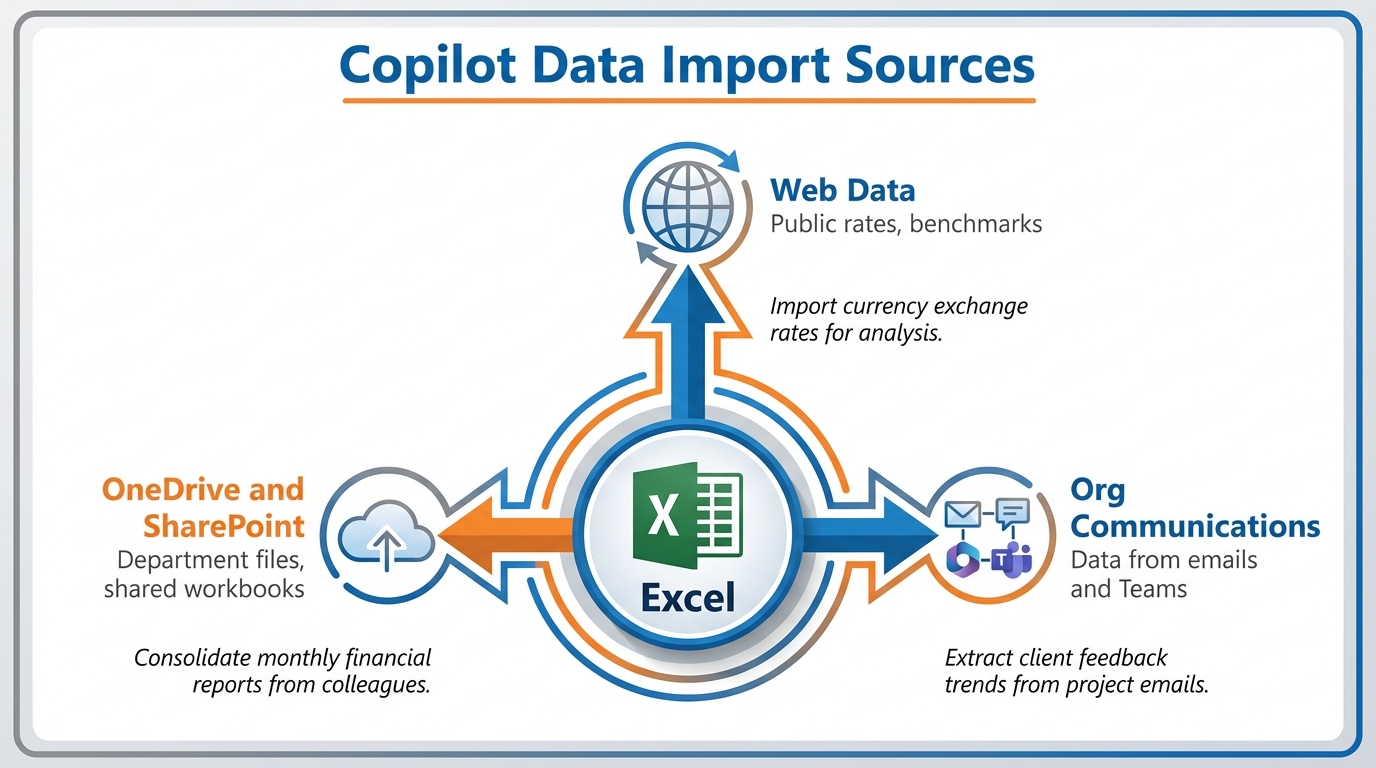
Figure 7:Copilot’s data import capability brings external data into your Excel workbook without requiring manual copy-paste or complex Power Query configurations — a meaningful time-saver for the data-pull step that precedes every analysis.
Importing from web sources:
You can ask Copilot to pull publicly available data from the web directly into your workbook. For banking professionals, this is most useful for reference data: market rate tables, published economic indicators, or publicly available benchmark data that you want to combine with internal performance figures.
Example: “Import the current prime rate and 10-year Treasury yield from a reliable web source into this workbook.”
Copilot attempts to locate the data, import it into a new sheet or table, and link it in a way that can be refreshed. As with all web-sourced data, you should verify the source and accuracy before incorporating it into analytical outputs.
Importing from OneDrive and SharePoint:
Copilot can help you pull data from other files in your Microsoft 365 environment — a related workbook, a SharePoint list, or a file a colleague has shared with you. This is particularly useful when building consolidated reports that draw from multiple departmental sources.
Importing from organizational communications:
Copilot can also bring in data from your organization’s Microsoft 365 communications — for example, extracting specific numbers or figures mentioned in emails or Teams messages into your spreadsheet for tracking. This is a narrower use case but a genuinely useful one for professionals who receive regular data updates via email (account summaries, weekly portfolio snapshots, etc.) and want to bring that data into a running workbook without manual re-entry.
1.77. The Verification Discipline — Why Human Review Is Non-Negotiable in Banking
We have now covered six categories of Copilot-in-Excel capability. Every one of them is real, confirmed, and genuinely useful. And every one of them requires the same professional discipline: you verify what it produces before you rely on it.
This is not a caveat to be skimmed past. It is the central professional skill of effective AI-assisted analysis.
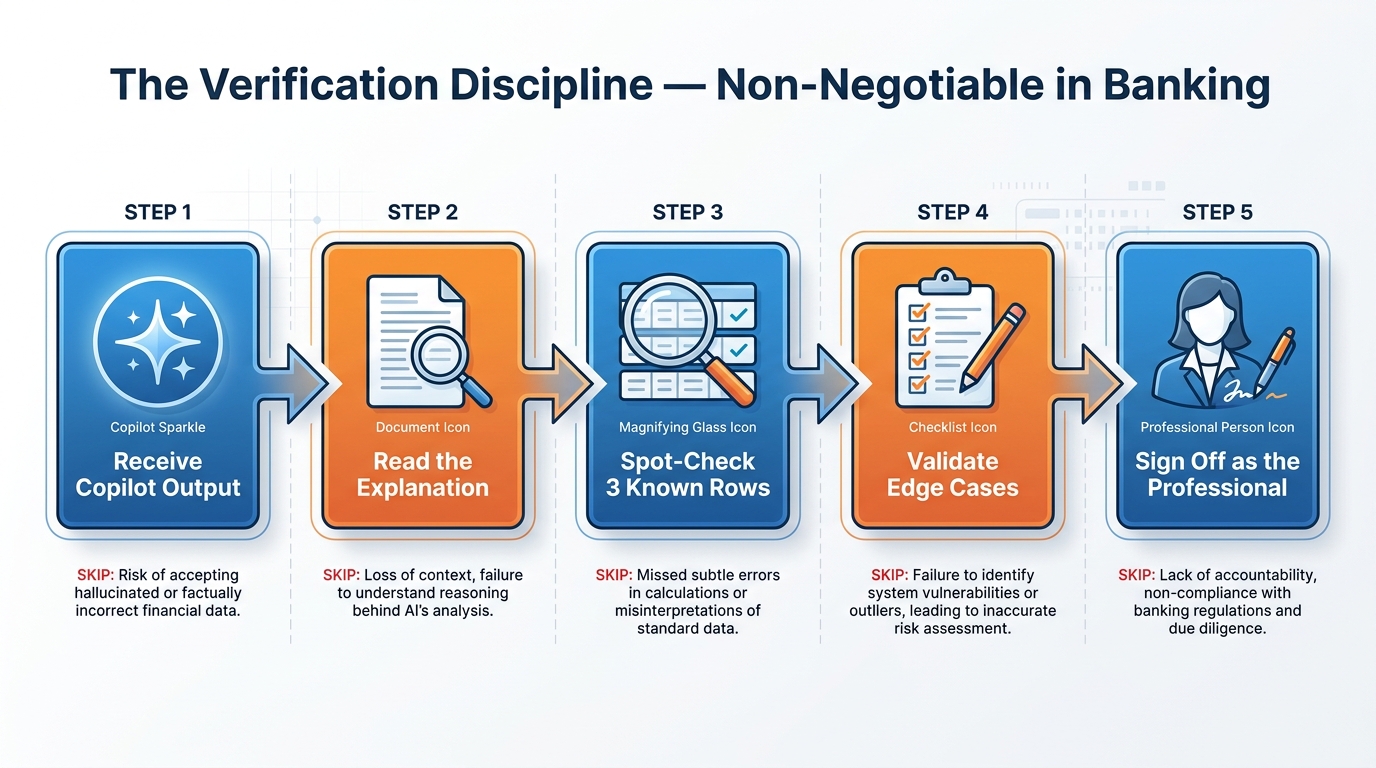
Figure 8:The verification discipline is not optional overhead — it is the professional skill that separates effective AI-assisted analysis from AI-dependent analysis. Copilot does the mechanical work. You own the results.
Why verification is especially critical in banking:
In most professional contexts, an AI error costs you embarrassment and a correction. In banking, an AI error in an analytical output that reaches a credit decision, a regulatory report, or a board presentation can cost significantly more — in reputation, in regulatory standing, and potentially in dollars. The stakes of not catching an error are higher here than in most industries.
What Copilot gets wrong in Excel:
Copilot in Excel is powerful, but it is not infallible. Here are the specific failure modes that banking professionals need to watch for:
The verification protocol for banking professionals:
Table 2:Verification Steps Before Relying on Any Copilot Output
Output Type | Verification Step | Why It Matters |
|---|---|---|
Generated Formula | Spot-check against 3+ known values; read the explanation; confirm column references | Syntactically correct formulas can be logically wrong |
Chart or Pivot Table | Verify the underlying data range; confirm the aggregation method; check that totals match | Charts can visualize the right data in a misleading way |
Trend Summary | Confirm the time period scope; check the specific data points cited; validate against a manual sample | Copilot synthesizes from what it sees; incomplete data produces incomplete analysis |
Outlier Flag | Investigate each flag individually; do not act on a flag without understanding it | Statistical outliers are candidates for investigation, not conclusions |
Imported Data | Verify the source; check for import date/freshness; cross-reference against authoritative source | Web and external data can be stale, incomplete, or sourced from unreliable locations |
The professional framing:
A skilled analyst does not trust their own formulas without testing them. A skilled analyst does not present a chart without knowing where the data came from and what it covers. The discipline you apply to AI-assisted outputs should be the same discipline you apply to any analysis — except that AI speeds up the production, which means the verification step must become more deliberate, not less, because there is now time pressure to skip it.
Copilot is not the analyst. You are the analyst. Copilot is the tool that removed the mechanical execution barrier between your question and your answer. The professional responsibility for the answer remains entirely yours.
1.88. What Copilot in Excel Cannot Do — Knowing the Limits
Being an effective user of any tool requires knowing where the tool ends. Here is an honest accounting of what Copilot in Excel cannot do — based on its documented capabilities and confirmed limitations.
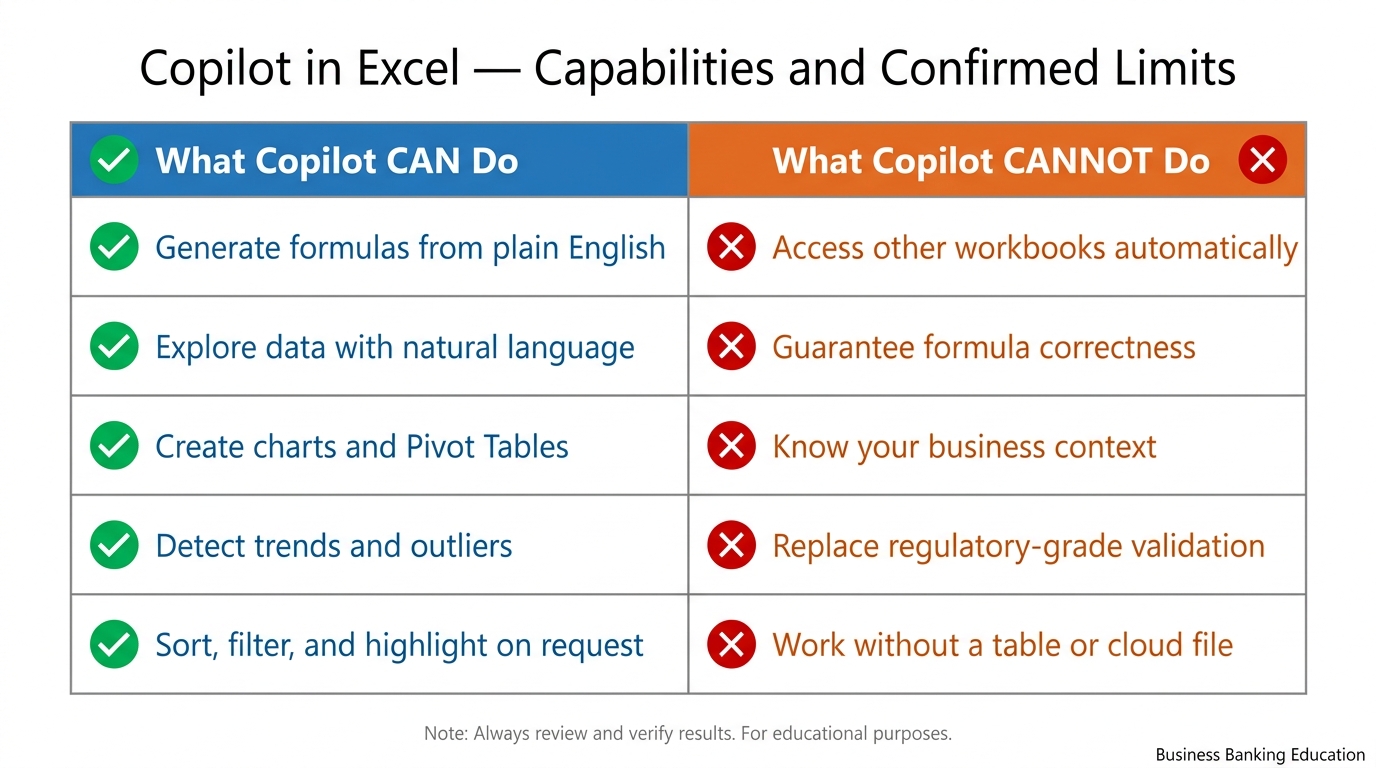
Figure 9:Knowing the limits is as important as knowing the capabilities. Effective Copilot use in banking requires both — the confidence to use it powerfully and the professional judgment to know where human oversight is mandatory.
What Copilot cannot do:
It cannot access other workbooks automatically. Copilot works with the data in the open workbook. If your analysis requires data from three different spreadsheets, you need to consolidate that data manually (or via Excel’s Power Query) before Copilot can work with it. Copilot is not automatically reading all your Excel files — only the one you have open.
It cannot guarantee formula correctness. Copilot generates formulas based on its understanding of your description and your table structure. If your description is ambiguous, or if your table structure is unusual, the formula may be wrong. There is no substitute for spot-checking.
It does not know your business context. Copilot cannot know that one branch had a one-time large deposit from a municipal client that distorted the quarter, that a loan officer is on leave and their pipeline should be excluded, or that last month’s figures were restated. It works with the numbers in front of it. You provide the context that makes those numbers meaningful.
It cannot perform regulatory-grade analysis. Any analysis that feeds a regulatory report — a Call Report, a stress test submission, an exam response — requires human validation, documented methodology, and professional sign-off. Copilot can help build the analysis, but it cannot substitute for the analytical validation process that banking regulators expect.
It cannot write Python code in Excel reliably. Python in Excel is a real Microsoft feature — it allows Python code to run inside Excel cells. However, Copilot’s ability to write Python code in Excel (as opposed to formula code) is not a confirmed, generally available feature as of this writing. If you have seen this discussed online, it may be in preview for specific users or environments. Do not build workflows around this capability until you have confirmed it works in your specific BankUnited Microsoft 365 tenant.
It does not work without a table. If you have not formatted your data as an Excel table, Copilot cannot read it. Full stop.
It cannot work offline. Copilot requires an internet connection and your Microsoft 365 credentials. It is a cloud-connected service.
1.99. What’s Coming — Announced Features to Watch
Microsoft regularly announces new Copilot capabilities before they reach general availability. As a BankUnited professional, it is useful to know what is on the roadmap — with the clear understanding that announced features are not the same as available features, and the timing of releases frequently shifts.
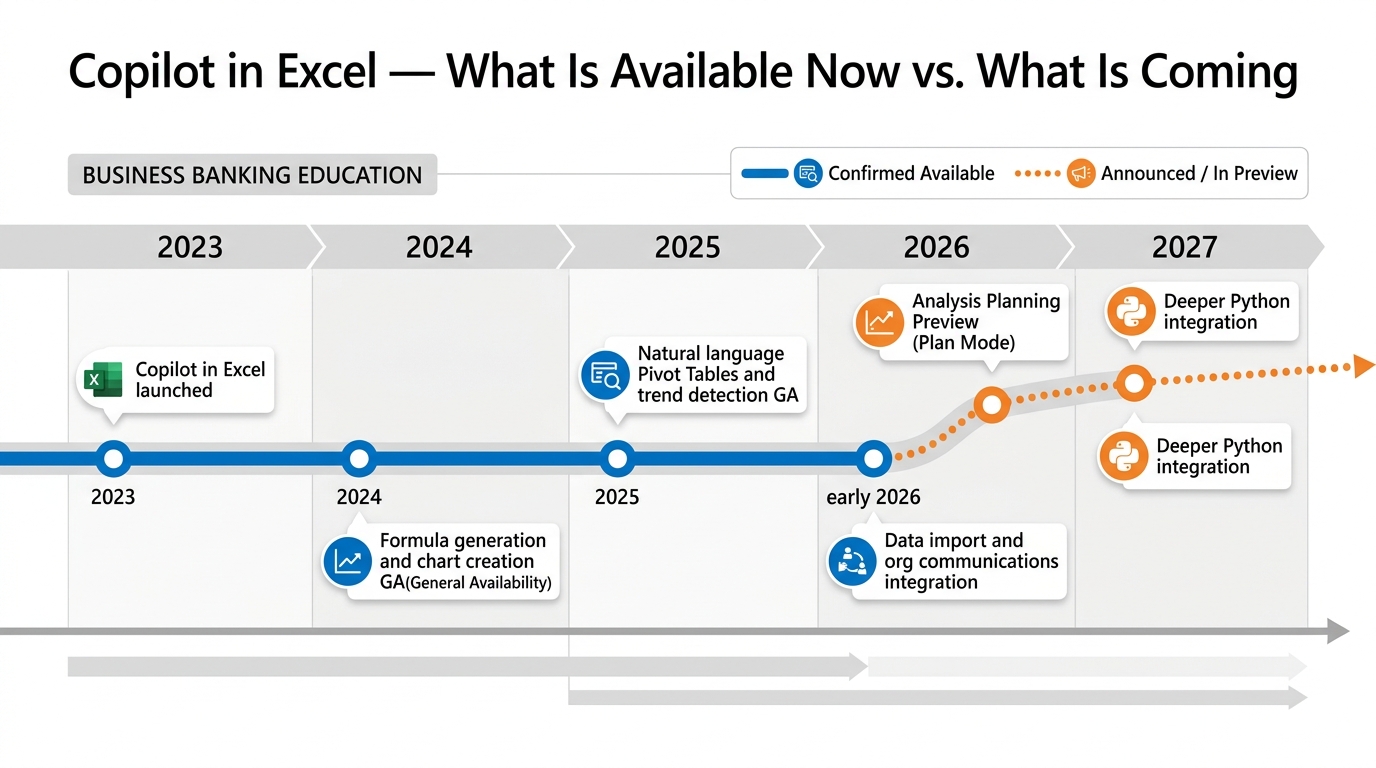
Figure 10:The Copilot in Excel capability trajectory — from its 2023 introduction through confirmed 2025–2026 features and announced capabilities that are in preview or rolling out. The dotted line represents announced but not yet generally available features.
Advanced Analysis Planning (Preview):
Microsoft has announced a capability — sometimes referred to in preview communications as “Plan Mode” or “Advanced Analysis” — in which Copilot will outline its analytical approach before executing it, giving users the ability to review and adjust the methodology prior to any changes being made to the workbook. This is a meaningful capability for banking professionals who need to understand and document the methodology behind their analyses.
As of this writing, this feature is in preview for select users and environments — it is not yet confirmed as generally available. If you are interested in whether it has reached your BankUnited Microsoft 365 tenant, check with your IT administrator or look for updates in Microsoft’s M365 admin center.
The underlying goal — giving professionals visibility into Copilot’s analytical methodology before it is applied — aligns directly with the audit and documentation requirements of banking analytics. When it reaches general availability, it will be an important addition to the professional workflow described in this chapter.
Python integration:
Microsoft has announced deeper integration between Copilot and Python in Excel, which would allow natural-language prompts to generate Python analytical scripts running inside Excel cells. This would extend Copilot’s analytical reach to statistical modeling, machine learning, and custom data processing that goes beyond Excel’s native formula capabilities. This feature is in active development and preview; watch for Microsoft announcements on its general availability.
For the most current feature status:
Microsoft 365 Admin Center → Message Center (for your IT administrator)
Microsoft 365 Roadmap — the official source for what is released, in preview, and planned
Your BankUnited IT team — who receive Microsoft communications about tenant-level feature availability
1.10🧪 Try This — A Complete Copilot-in-Excel Analysis Session
This exercise takes you through the complete workflow — from properly set-up data to analyzed insight — using only confirmed Copilot capabilities. It is designed to be done with real or realistic data in your BankUnited Microsoft 365 environment.
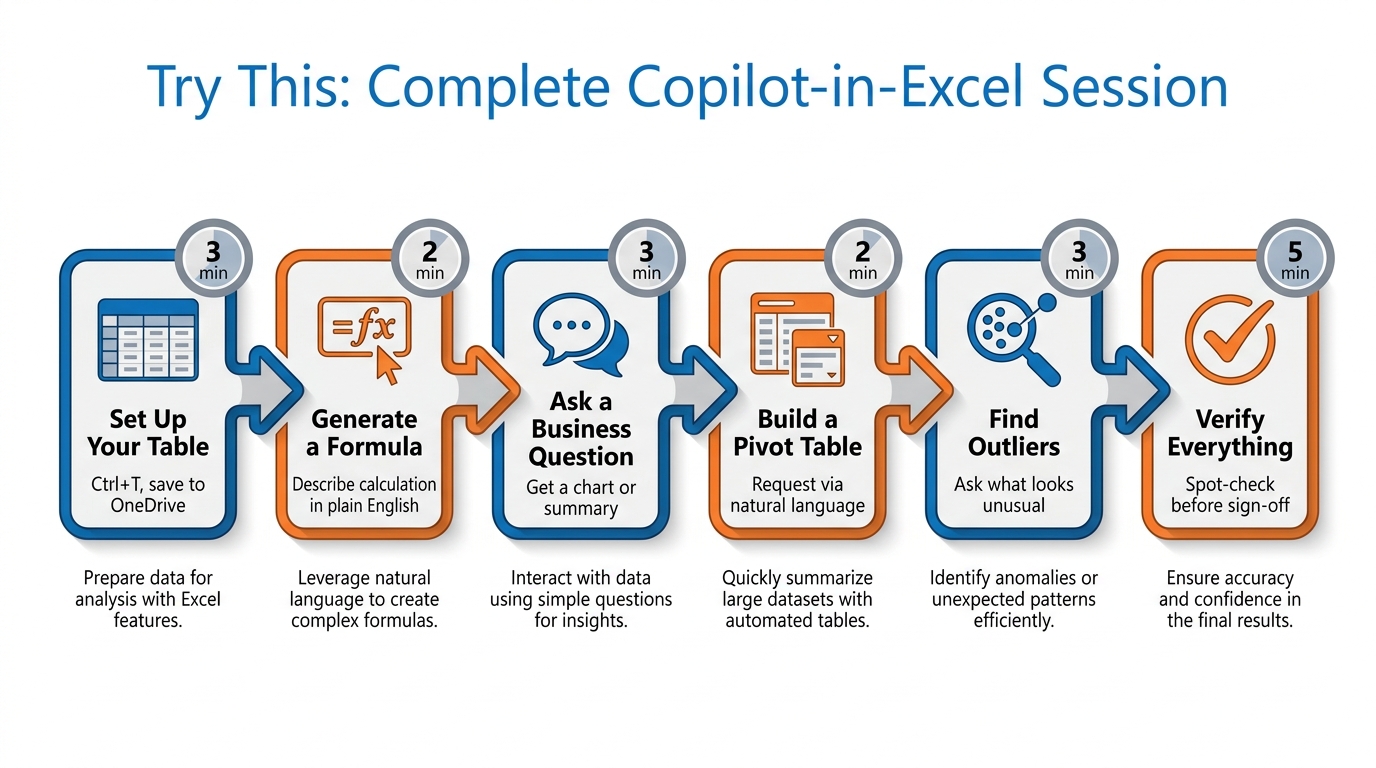
Figure 11:The six-step Copilot-in-Excel workflow — from raw data to verified analytical insight. First run: approximately 20 minutes. Repeated use: under 5 minutes once the workflow is familiar and your data is consistently structured.
1.11The Bigger Picture — What Excel Becomes
Before we close, let’s step back and look at what Copilot in Excel actually represents — not feature by feature, but as a shift in professional capability.
Excel has been the world’s most widely used data tool for four decades. Through that entire history, its fundamental interaction model remained constant: you, the professional, expressed your analytical intent by constructing formulas, building Pivot Tables, creating charts, and writing macros. The computer executed exactly what you told it to, in the language you had learned. The analytical floor — the minimum you had to know to get useful output — was relatively high.
Copilot lowers that floor dramatically. The professional knowledge required to ask a question of your data is now English fluency, not Formula fluency. The ceiling of what non-programming professionals can analyze without a data science team rises significantly. And the time between “I have this question” and “I have this answer” compresses in ways that change which questions get asked at all.
This is not a replacement of analytical professionals. It is a reallocation of their time. The same professional who was spending 60% of analytical time on mechanical execution — formula construction, table building, chart formatting — can now spend that time on interpretation, judgment, and decision-making. Which is, not coincidentally, what they were hired to do.
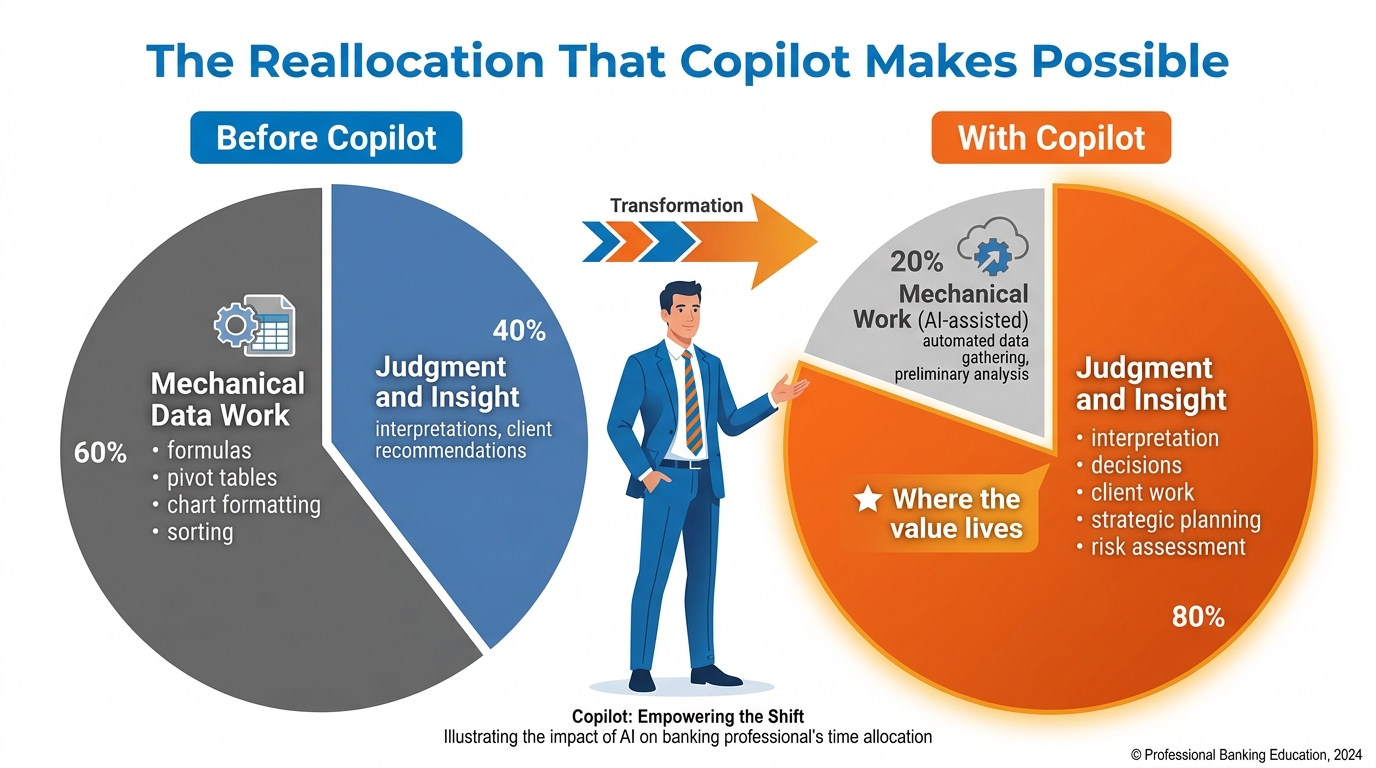
Figure 12:The fundamental reallocation that Copilot in Excel enables — not from humans to AI, but from mechanical execution to professional judgment. Same professional. Same hours. Dramatically different ratio of valuable work to mechanical work.
For BankUnited specifically:
Every analytical professional at BankUnited — every relationship manager who builds client performance summaries, every credit analyst who models loan risk, every branch manager who tracks deposit composition, every operations professional who reviews transaction data — can do more, faster, with better documentation of how they got there.
The competitive dimension is real. Banks that build organizational fluency in AI-assisted analytics will have professionals who answer harder questions faster, with more consistent quality, and with capacity for more of the client-facing and judgment-intensive work that drives relationship value.
But the competitive dimension starts with a single professional, on a single dataset, asking a question they would not have had time to ask before. That is what this session has been building toward.
Start with one dataset. Format it as a table. Open Copilot. Ask it something.
See what it shows you.
Excel Table A structured data range in Microsoft Excel with defined headers, formatted via Insert → Table or Ctrl + T — the required data format for Copilot in Excel to read and analyze your data.
Formula Generation Copilot’s ability to create syntactically correct Excel formulas from plain-English descriptions, including complex functions such as XLOOKUP, SUMIFS, nested IFs, and statistical calculations.
Formula Explanation Copilot’s ability to read an existing Excel formula and explain what it does in plain English — useful for understanding inherited models or auditing complex calculations.
Natural-Language Data Exploration The Copilot capability that allows professionals to ask business questions of their Excel data in plain English and receive answers as charts, Pivot Tables, text summaries, or highlighted ranges.
Trend Identification Copilot’s analytical capability to detect directional patterns across a temporal dataset — identifying which metrics are consistently rising, falling, or exhibiting change-of-direction signals.
Outlier Detection Copilot’s statistical capability to surface data points that deviate significantly from the patterns in a dataset — candidates for human investigation, not automatic conclusions.
Verification Discipline The professional practice of checking every Copilot output — formulas, charts, Pivot Tables, analytical summaries — against known values or alternative evidence before relying on it for decision-making or reporting.
Microsoft 365 Roadmap Microsoft’s official public tracker of Microsoft 365 feature releases — showing what is available, what is in preview, and what is planned. The authoritative source for feature status questions.
OneDrive for Business Microsoft’s cloud file storage service integrated with Microsoft 365 — the required storage location for Excel files to be accessible by Copilot in Excel.
Hallucination (in Excel context) The risk that Copilot generates a formula or analytical conclusion that appears correct but is logically wrong — a known AI limitation that makes the verification discipline mandatory rather than optional.